3 Smoothing
The spatial interpolation of the incidence rates was conducted separately for each country (e.g. not across national borders) using the uniform methodology invented and developed at the Finnish Cancer Registry (Pukkala et al, 2001).
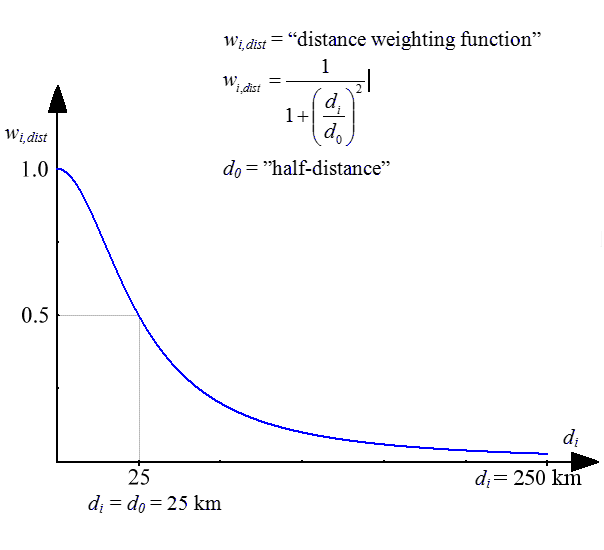
Rates for cities with at least 100,000 inhabitants are shown as circles with a diameter relative to the population size, with the colour shading indicating the incidence rate in that city. The remaining rates are shown as floating averages of several neighbouring municipalities. The rate for each grid (size 2.5 x 2.5 km) on the map was defined as a weighted average of the age-adjusted incidence rates in the municipalities, with population centres within 250 km from the centre of the grid. The weights were inversely-associated with distance; the weight being halved where the distance was 25 km (see weighting function). In addition, the weights were made directly proportional to the sizes of the populations within the 250 km circle.
The northern parts of